0 items
Start adding resources to combine and download them together!
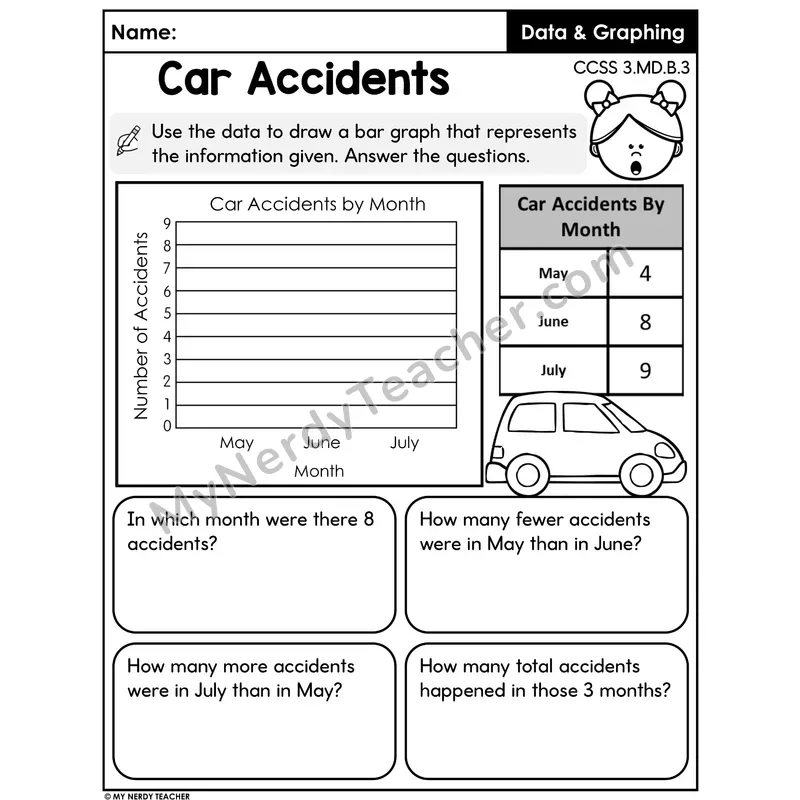
Students draw a bar graph from a data table about car accidents by month and answer comparison questions.
Log in or sign up to download.