0 items
Start adding resources to combine and download them together!
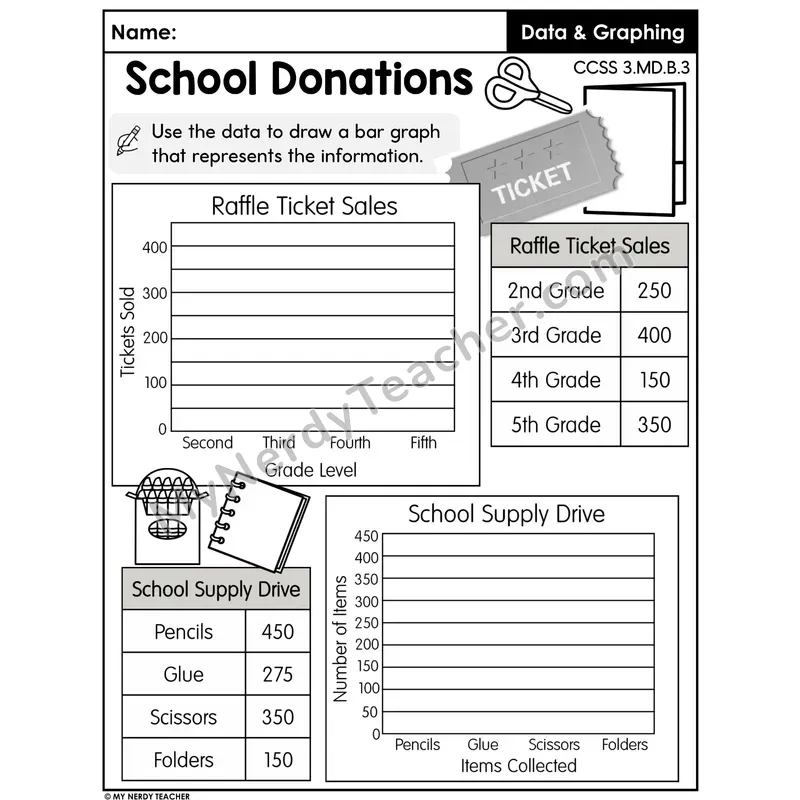
Students draw two scaled bar graphs from data about raffle ticket sales and school supply drive collections.
Log in or sign up to download.