0 items
Start adding resources to combine and download them together!
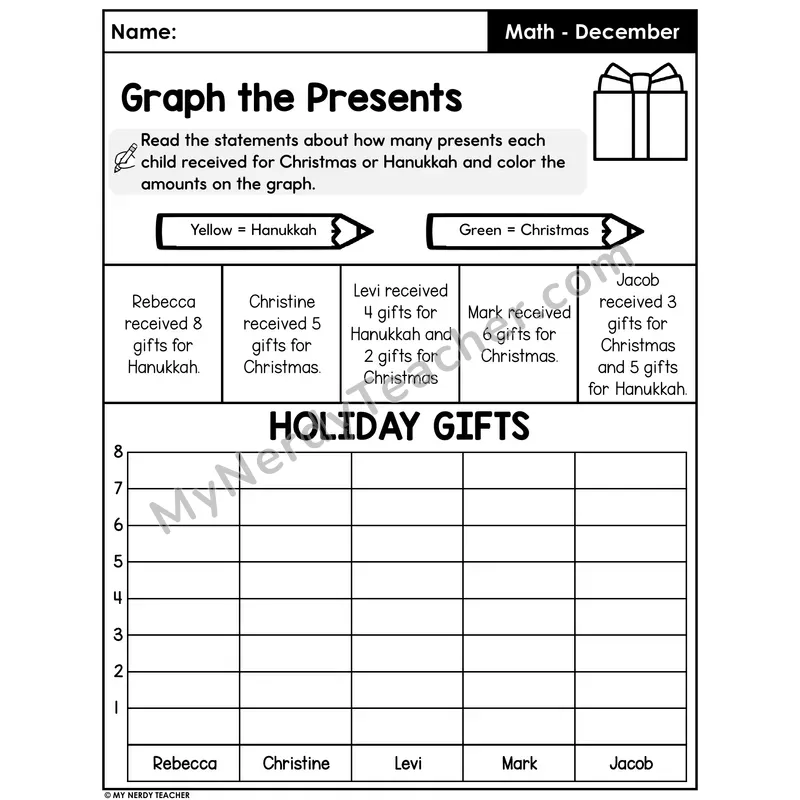
A bar-graph data worksheet. Students read five statements about how many gifts each child (Rebecca, Christine, Levi, Mark, Jacob) received for Christmas or Hanukkah, then color the bar graph in yellow (Hanukkah) or green (Christmas). Two students received gifts for both holidays, requiring stacked bars. Use to practice representing and reading categorical data.